#02 Circular Barplot
Character Gender Composition of Series
DV Details
- Creator : Clarissa Wiraharjo
- DV Type : Circular Barplot (static)
- Category : Dataset Composition
- Tools Used : R
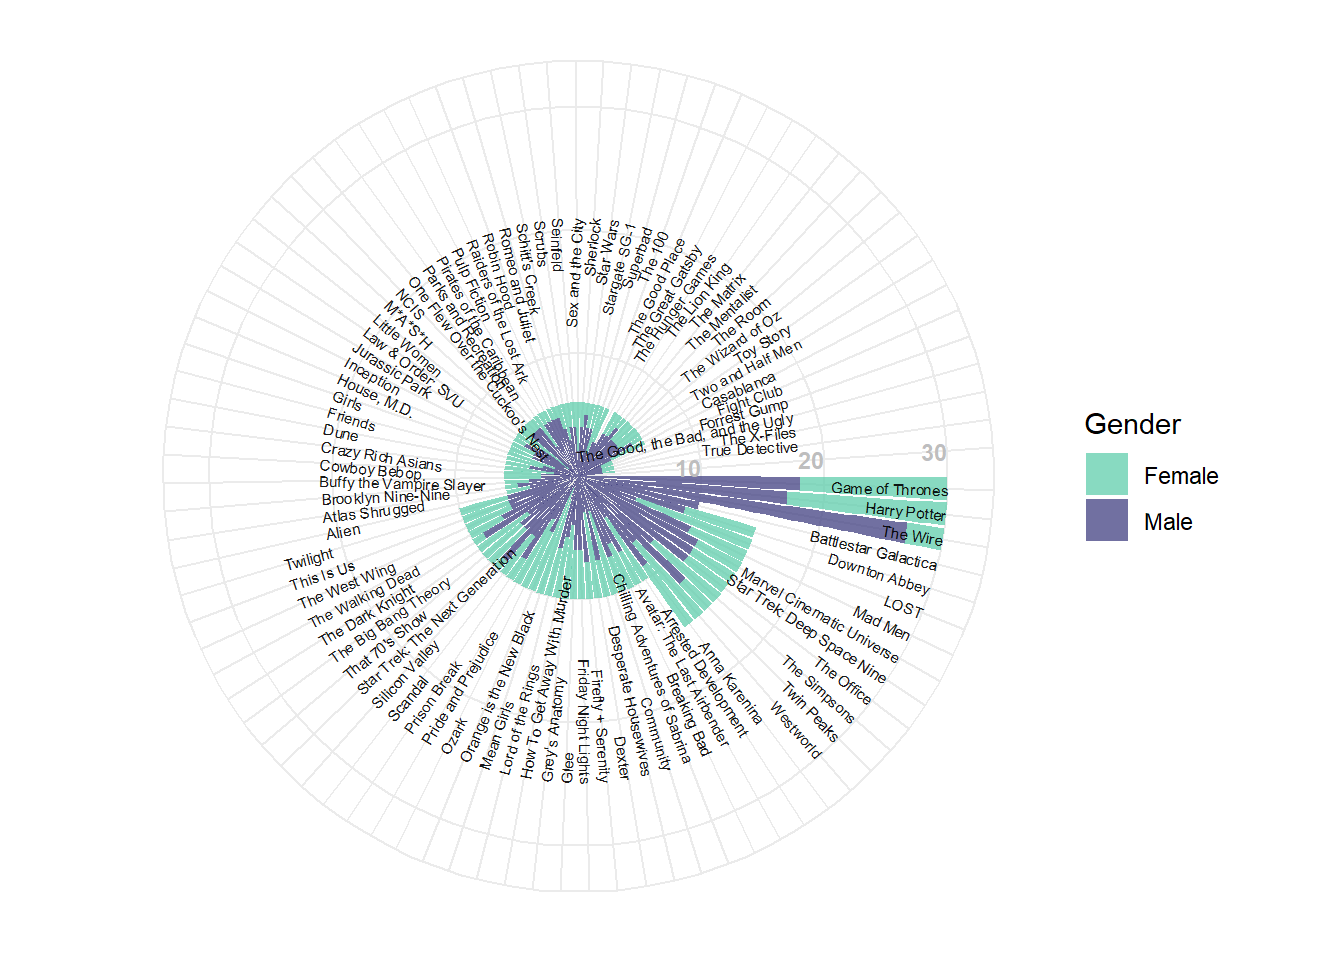
The circular barplot helps immensely in visualizing a large amount of data points together and making barplots more aesthetically pleasing. The bars can indicate the amount of characters in a series well, while the colors indicating the proportion of genders in each series. It can then be observed for example, that while Game of Thrones and Harry Potter have a fair balance of male and female characters, the Wire series is dominated by male characters.
Although it is difficult to exactly determine the exact number of characters in each series through this DV and pinpoint which series correspond to which plot, it can provide users a good idea on the number of characters a certain series has, and the distribution of number of characters in the Open-Psychometrics dataset.
However, a downside to this type of DV is that the higher the numbers the more area space it will consume, which might mislead the audience that higher values have significantly more than slightly lower values. It would also be a lot more helpful if the size of the plot is larger, as R does not allow zooming in of the plot in the code. It would also greatly help if it allows interactivity, to make the visualization a lot neater without having to label the bars, hence Tableau seems like a more effective option for this kind of DV instead of R.