#03 Histogram
Personality Spectrum Distribution
DV Details
- Creator : Clarissa Wiraharjo
- DV Type : Histogram (interactive)
- Category : Personality Spectrum
- Tools Used : Tableau
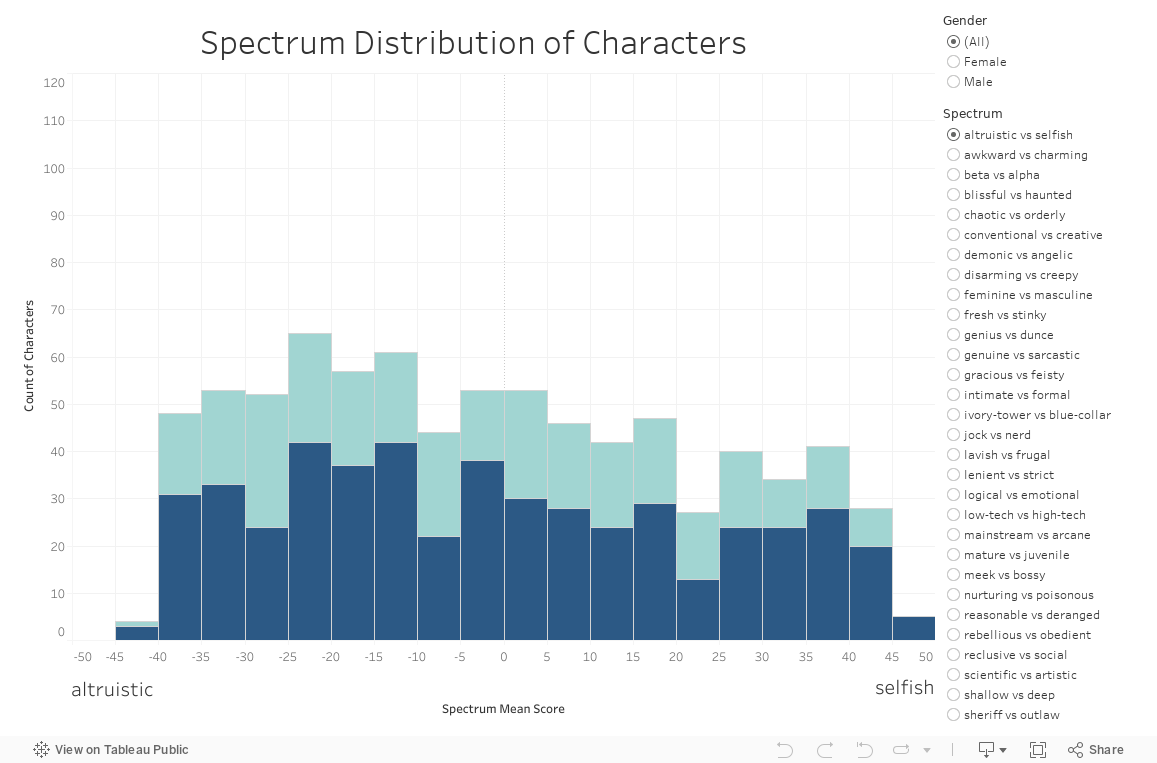
This DV presented in Tableau allows user customization, interactivity and filtering to learn about the distribution of number of characters across a personality spectrum of their choice. It also makes use of colors to represent the genders of the characters making the count of the histogram. The interactivity and filter function of this DV really allows users to learn as much as their curiosity needs
It is very interesting to see these distributions of spectrums, as for example, it can be observed that for the feminine vs masculine spectrum, unsurprisingly, females mostly fall in the feminine spectrum and vice versa, while the tame vs wild spectrum shows a more even distribution across both genders. Additionally, it also intriguing that spectrums such as traitorous vs loyal are highly skewed to the loyal, which indicates that the majority of characters are loyal, which is reasonable as most likely those rated on the lower side of the spectrum are villain characters and a few handful of other non-prominent characters.