#07 Lollipop Chart
Personality Spectrums of a Character

DV Details
- Creator : Clarissa Wiraharjo
- DV Type : Lollipop Chart (interactive)
- Category : Character Personalities, Personality Spectrum
- Tools Used : Tableau
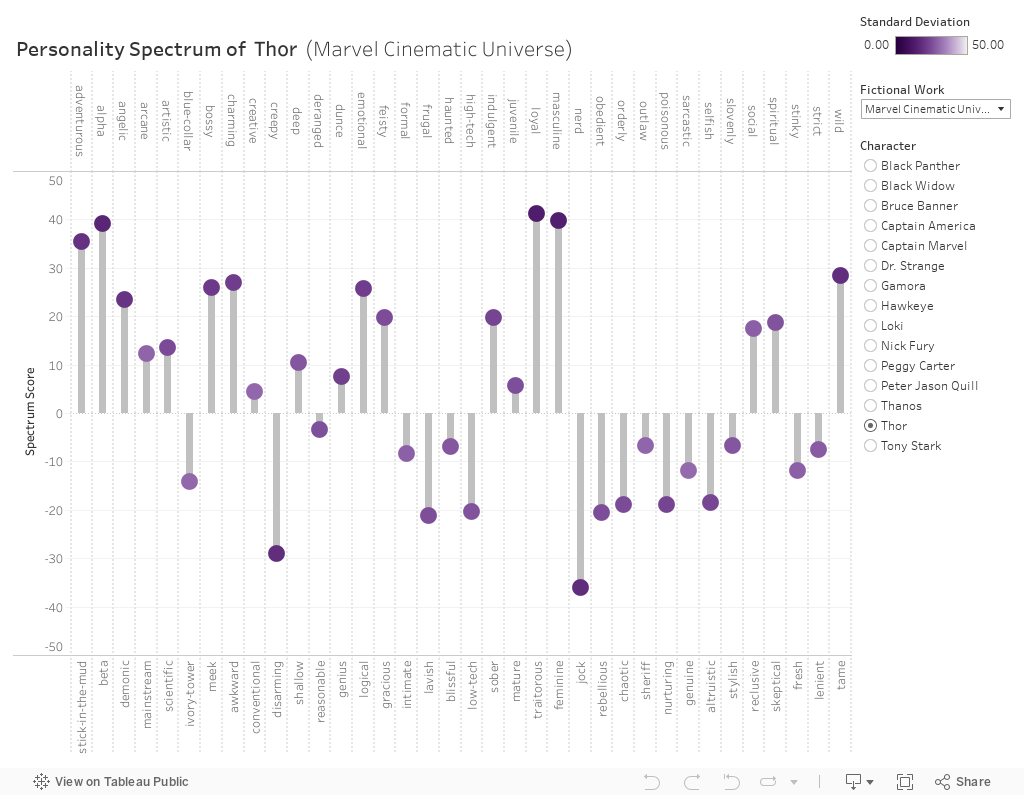
This lollipop chart constructed in Tableau displays all the personality spectrum scores for a certain character selected by the user. Users can filter and select a fictional work and character to display their personality spectrums at a glance, and learn about the standard deviations of these scores through the colors of the ‘lollipops’. The chart itself is very interactive, and allows user to select a data point and learn more about the personality spectrum and their exact mean and standard deviation values of a certain character.
It gives users a good picture of the personality indicators of a certain character, such as a personality trait a character is strongest on, such as for example, Thor is mostly defined as a jock, masculine, adventurous and loyal, while is on the fence between dunce and reasonable, and juvenile and mature.
As these visualizations are also responsive, users can see the movements in plots whenever they change the filter to select another character, hence allowing them to get a general idea on which personality spectrums two characters have large differences in, although it can probably be helpful if they can visualize the personality spectrums of two characters at the same time for easier comparison.