Data manipulation
First, we load the data on the character index.
load("~/COMM2501 Portfolio - z5218332/files/character_index.Rda")
head(character_index)
## character_code fictional_work character_name gender
## 1 A/01 Alien Dallas Male
## 2 A/02 Alien Ellen Ripley Female
## 3 A/03 Alien Lambert Female
## 4 A/04 Alien Ash Male
## 5 A/05 Alien the Alien Male
## 6 A/06 Alien Parker MaleThen, we want to count the number of characters in each series, and how many of each genders are in each,
To make sure, we check total number of series and characters.
nrow(series_character_no)## [1] 90sum(series_character_no$Total, na.rm = TRUE)## [1] 800Treemap DV construction
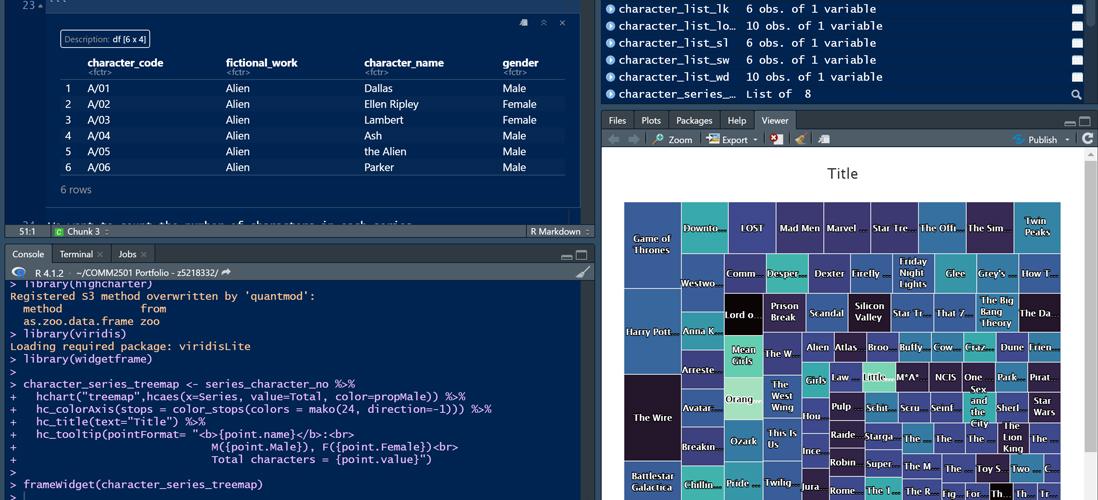
As the dataset is ensured that it’s complete, we can then proceed with constructing the interactive treemap of the character compositions! Using mainly the highcharter package, the treemap object is first created.
library(treemap)
library(htmlwidgets)
library(highcharter)
## Registered S3 method overwritten by 'quantmod':
## method from
## as.zoo.data.frame zoolibrary(viridis)## Loading required package: viridisLitelibrary(widgetframe)
character_series_treemap <- series_character_no %>%
hchart("treemap",hcaes(x=Series, value=Total, color=propMale)) %>% #determine the independent variables by the seris, size to be determined by the number of characters, and the colors to be determined by the proportion of males in the series
hc_colorAxis(stops = color_stops(colors = mako(24, direction=-1))) %>% #determining the color palette for the proportion indicator
hc_title(text="Series and Characters Composition of Open-Psychometrics") %>%
hc_tooltip(pointFormat= "<b>{point.name}</b>:<br>
M({point.Male}), F({point.Female})<br>
Total characters = {point.value}") #to show further information when cursor hovers over a seriesDisplaying the treemap:
frameWidget(character_series_treemap)