Clarissa Wiraharjo


I’m a 3rd year Bachelor of Actuarial Studies/ Commerce student as of 2021. I currently have more interest to the data science area, especially on it applications to psychology and personality. Using data to gain knowledge about something that’s not just money and numbers is really fascinating to me! I have skills on R, Adobe Photoshop and just recently Tableau, which I mainly use to create this site and my portfolio. Other than that, I am familiar with Python, SQL, HTML and CSS.

I’m a huge fiction and personality psychology enthusiast, thus Open-Psychometrics really piqued my interest and I really enjoyed working with this dataset especially. I got to learn so much about data visualization, how to be creative in visualizing data to tell a story regarding character personalities and at the same time learn about personality distributions and correlations of the fictional characters I know.


Posted by Clarissa Wiraharjo

Lollipop Chart (Tableau) - Personality Spectrums of a Character

Lollipop Chart (Tableau) - Personality Spectrums of a Character

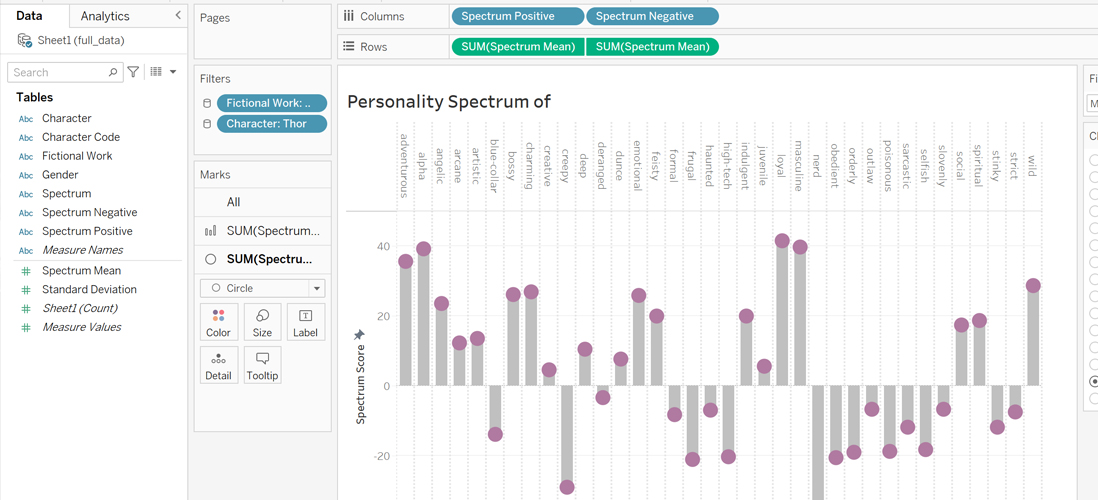
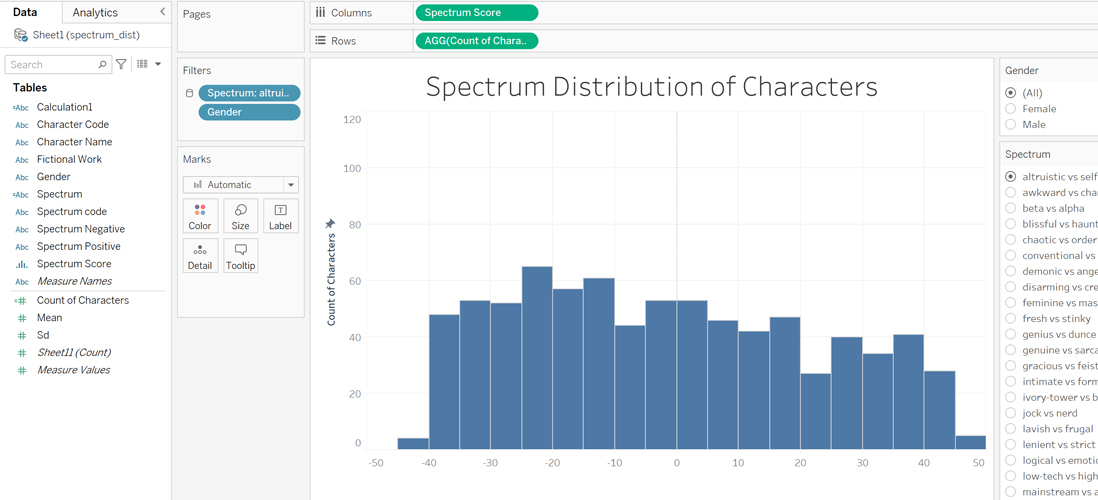
Lollipop Chart DV construction using Tableau Public For fun, this DV aims to indicate the personality scores for the 36 spectrums in the recommended version of the Open-Psychometrics test.

Continue reading
Chord Diagram - Characters with Opposite Personalities

Chord Diagram - Characters with Opposite Personalities

In this DV, characters with opposite personalities will be linked together in a chord.

Continue reading
Interactive Network - Characters with Similar Personalities

Interactive Network - Characters with Similar Personalities

This DV will visualize an interactive network of characters with similar personalities.

Continue reading
Correlation Plot - Character Personalities

Correlation Plot - Character Personalities

This blog will show the DV construction of an interactive correlation plot of the Marvel Cinematic Universe characters.

Continue reading
Histogram (Tableau) - Personality Spectrum Distribution of Dataset

Histogram (Tableau) - Personality Spectrum Distribution of Dataset

Saving R dataframe to Excel file First we want to first convert the full, cleaned dataset, which was written in R dataframe previously, to an Excel format.

Continue reading
Circular Barplot - Character and Gender Composition of each Series

Circular Barplot - Character and Gender Composition of each Series

Data preparation Working with the similar data as the previous treemap, first, the dataframe file is loaded from the directory.

Continue reading
Treemap - Characters and Series Composition of Dataset

Treemap - Characters and Series Composition of Dataset

Data manipulation First, we load the data on the character index.

Continue reading
Data Analysis

Data Analysis

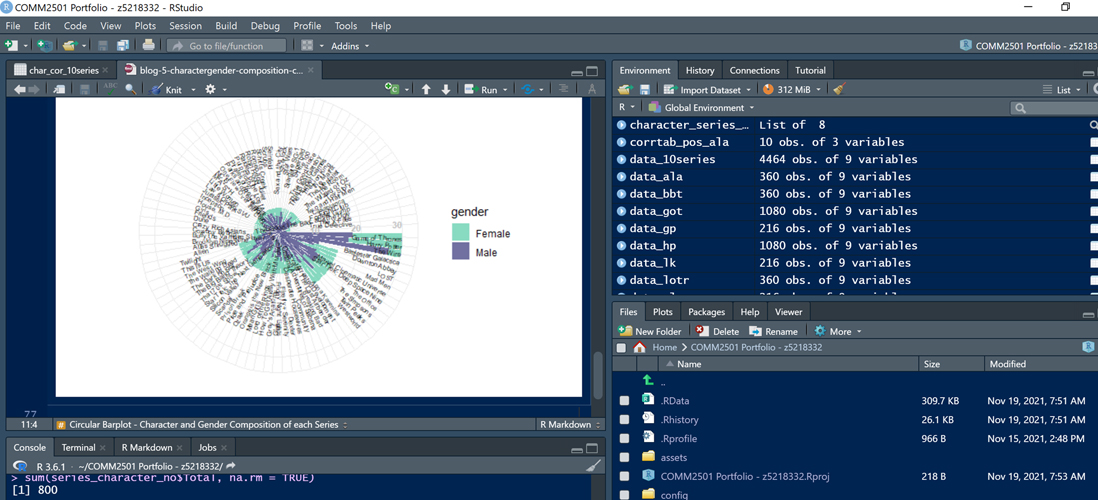
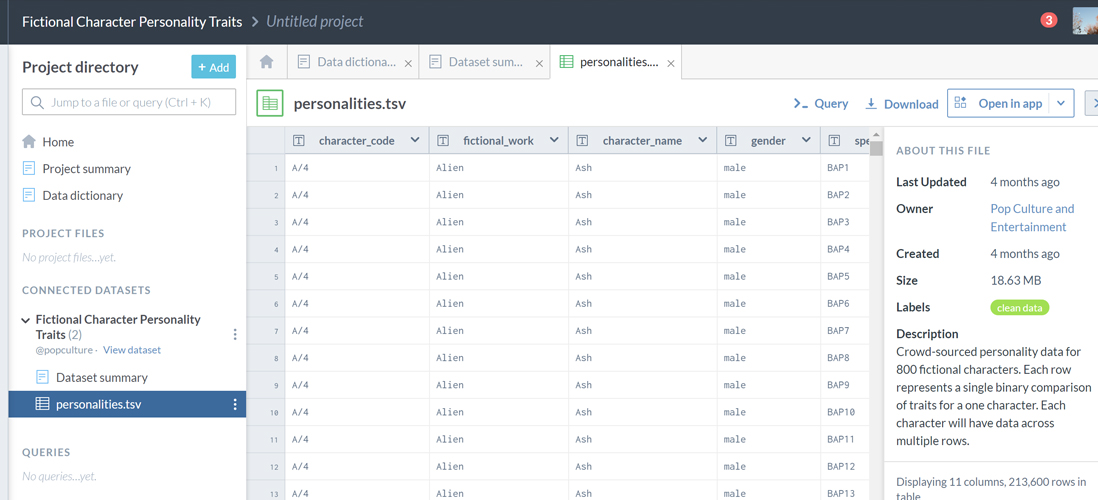
Data for Dataset Composition DVs From the previous blog on data preparations, I will be using several main datasets to work with different purposes of DVs.

Continue reading
Data Preparation

Data Preparation

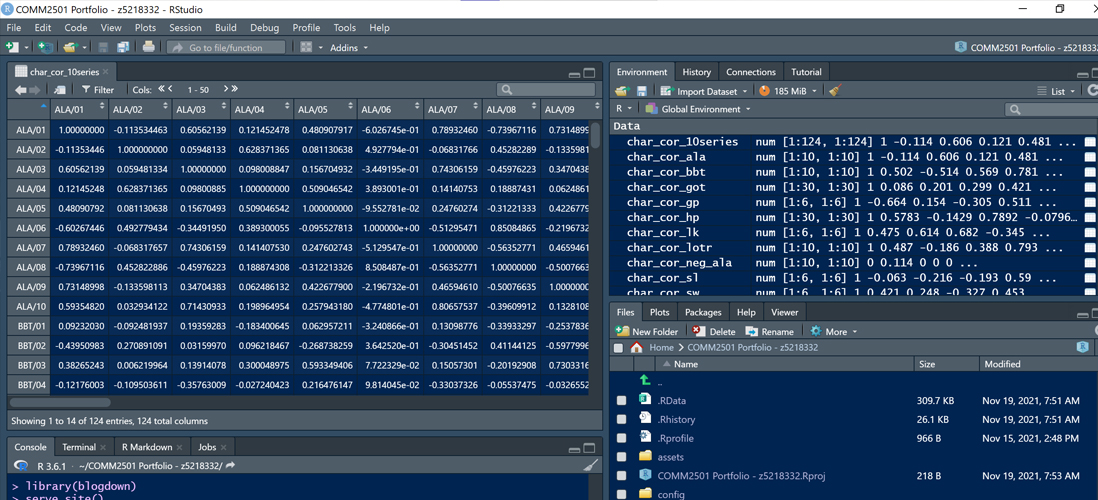
Dividing the data to 10 selected series To make visualizations regarding character personalities, as there are a total of 800 characters, it would be difficult to compare their personality spectrums.

Continue reading
Data Exploration and Selection

Data Exploration and Selection

Data Source The Open-Source Psychometrics Personalities dataset is provided on the website itself, yet its data is not entirely clean.

Continue reading