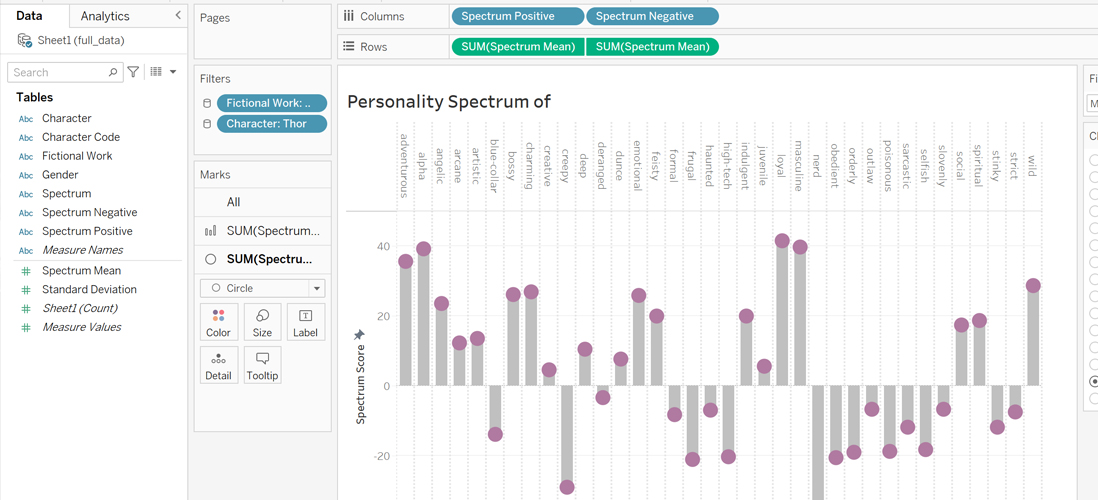
Lollipop Chart (Tableau) - Personality Spectrums of a Character
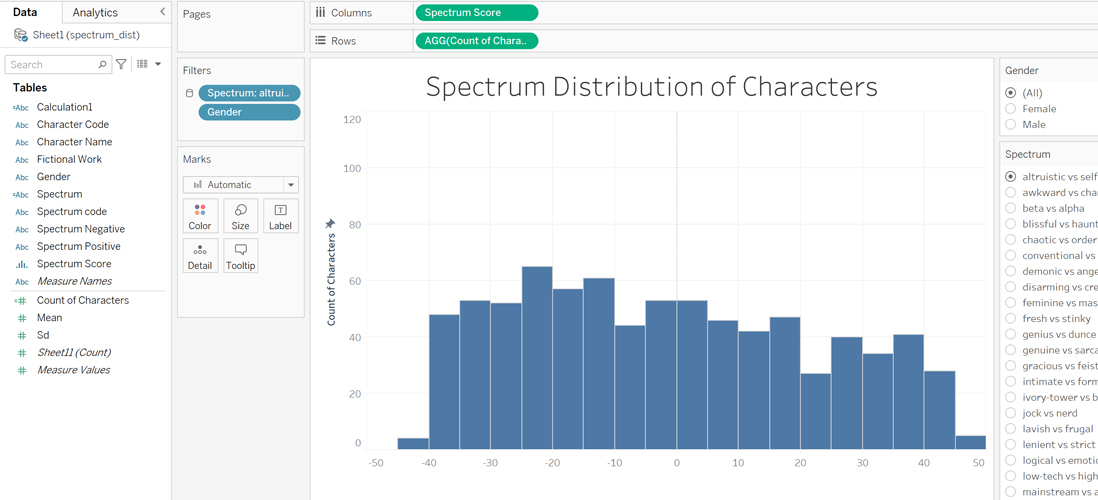
Lollipop Chart DV construction using Tableau Public For fun, this DV aims to indicate the personality scores for the 36 spectrums in the recommended version of the Open-Psychometrics test.
Continue reading