This DV will visualize an interactive network of characters with similar personalities. Characters of 10 selected series such as Avatar the Last Airbender, Game of Thrones, The Good Place, Harry Potter, The Lion King, The Lord of the Rings, Marvel Cinematic Universe, Sherlock, Star Wars and The Walking Dead. Characters with similar personalities will be linked together, which will ultimately create a network.
Data preparation and wrangling
We first load the dataframes of the character index, correlation matrices and the full data of the 10 selected series.
setwd("~/COMM2501 Portfolio - z5218332")

load("~/COMM2501 Portfolio - z5218332/files/character_index.Rda")
load("~/COMM2501 Portfolio - z5218332/files/char_cor_10series.Rda")
load("~/COMM2501 Portfolio - z5218332/files/data_10series.Rda")
Consequently, the character names will be extracted from the full data, and used to rename the columns and rows of the character correlation. These are in the same order as both were arranged based on character codes.
library(dplyr)##
## Attaching package: 'dplyr'## The following objects are masked from 'package:stats':
##
## filter, lag## The following objects are masked from 'package:base':
##
## intersect, setdiff, setequal, unioncharacter_list_10series <- data_10series %>% select(character_code, fictional_work, character_name) %>% distinct() %>% arrange(character_code) %>% select(character_name)
colnames(char_cor_10series) <- as.character(character_list_10series[,1])
rownames(char_cor_10series) <- as.character(character_list_10series[,1])We then want to filter the connections of characters with correlations of only 0.5 to 0.999 (as correlation above 0.999 will be very unlikely, and a correlation of 1 will be correlation with themselves). Then create the dataframe of from and to connections.
Interactive network DV construction
library(viridis)## Loading required package: viridisLitecharacter_list_10series <- character_list_10series %>% mutate(label=id) %>%
mutate(color=ifelse(gender=="Male",mako(1,begin=0.3), mako(1,begin=0.8))) %>%
mutate(title=paste0("<x style='color:#000000'>","<b>Series:</b>","<br>",{Series},"</x>")) #construct the tooltip information for when a cursor hoversWe then construct the visual network using the dataframe which we have created using the visNetwork package.
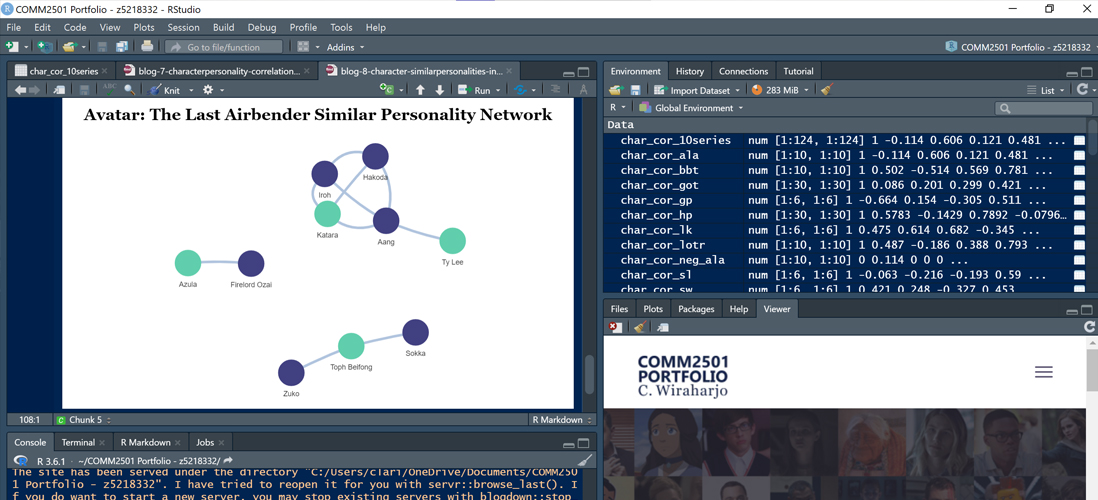
library(visNetwork)
visNetwork(character_list_10series, corrtab_pos_10series[,1:2],
           main="<x style='color:#000000'> Fictional Characters Similar Personality Network </x>") %>%
  visEdges(color =  "#B0C4DE" , width=5) %>%
  visOptions(highlightNearest = TRUE)
Note that you can zoom in, zoom out, and double click on a character to find out those they are linked to :)
(Please be patient to wait for the visual network DV to load because it is quite heavy, but I think it’s worth it because it’s really fun to explore around!)