Blog

Lollipop Chart (Tableau) - Personality Spectrums of a Character

Lollipop Chart (Tableau) - Personality Spectrums of a Character

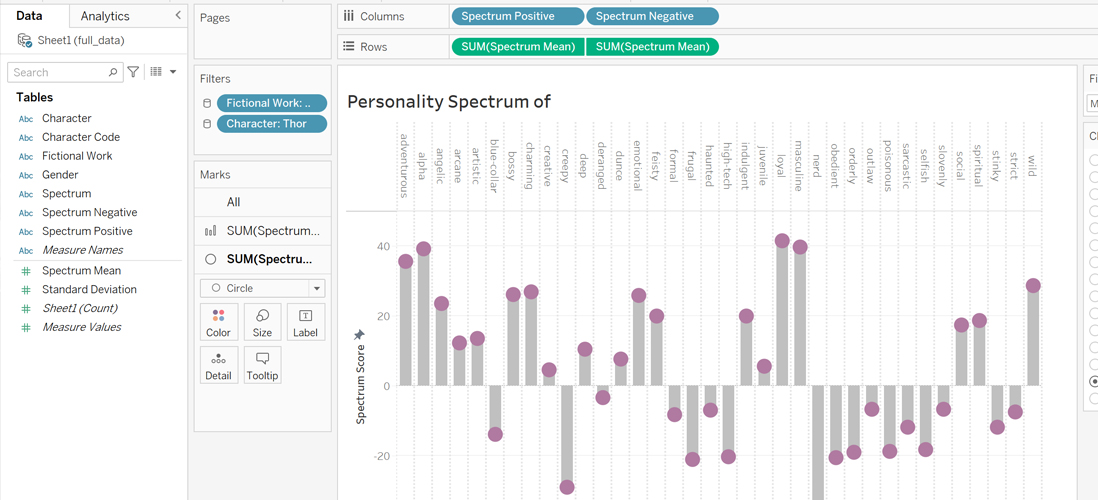
Lollipop Chart DV construction using Tableau Public For fun, this DV aims to indicate the personality scores for the 36 spectrums in the recommended version of the Open-Psychometrics test.

Continue reading
Chord Diagram - Characters with Opposite Personalities

Chord Diagram - Characters with Opposite Personalities

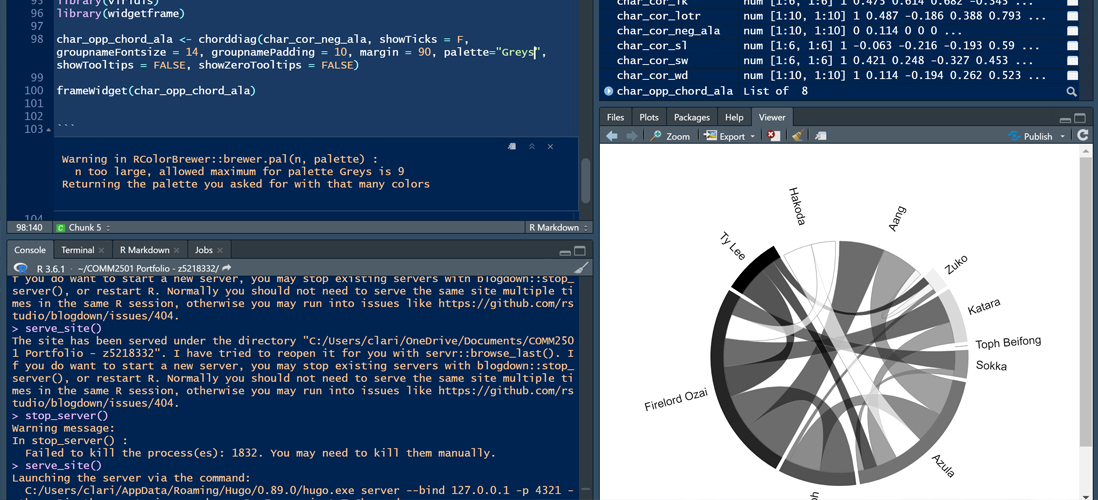
In this DV, characters with opposite personalities will be linked together in a chord.

Continue reading
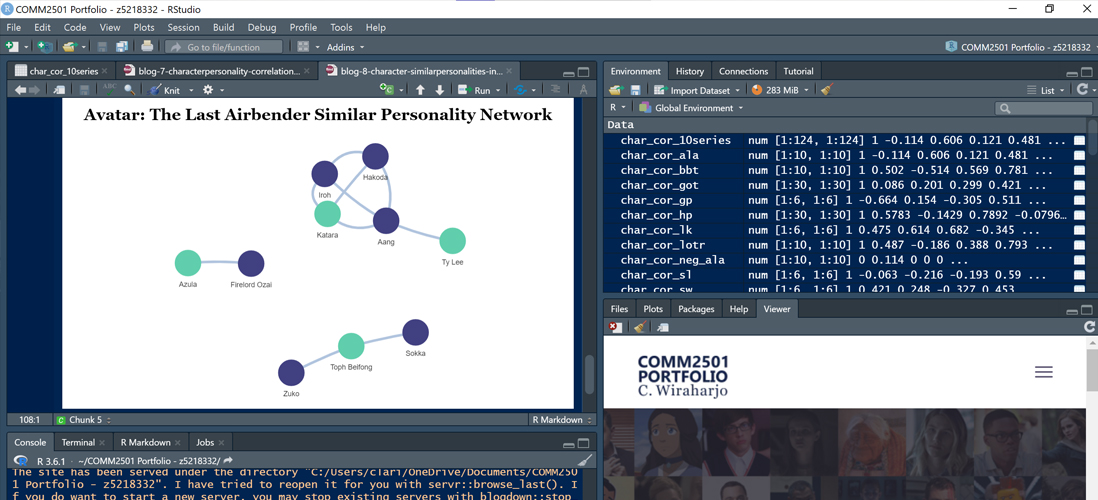
Interactive Network - Characters with Similar Personalities

Interactive Network - Characters with Similar Personalities

This DV will visualize an interactive network of characters with similar personalities.

Continue reading
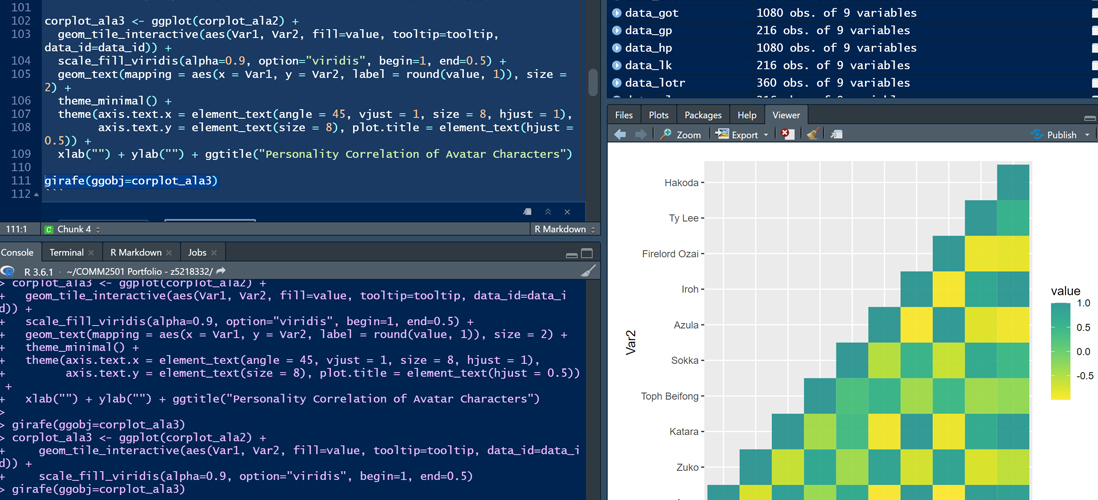
Correlation Plot - Character Personalities

Correlation Plot - Character Personalities

This blog will show the DV construction of an interactive correlation plot of the Marvel Cinematic Universe characters.

Continue reading
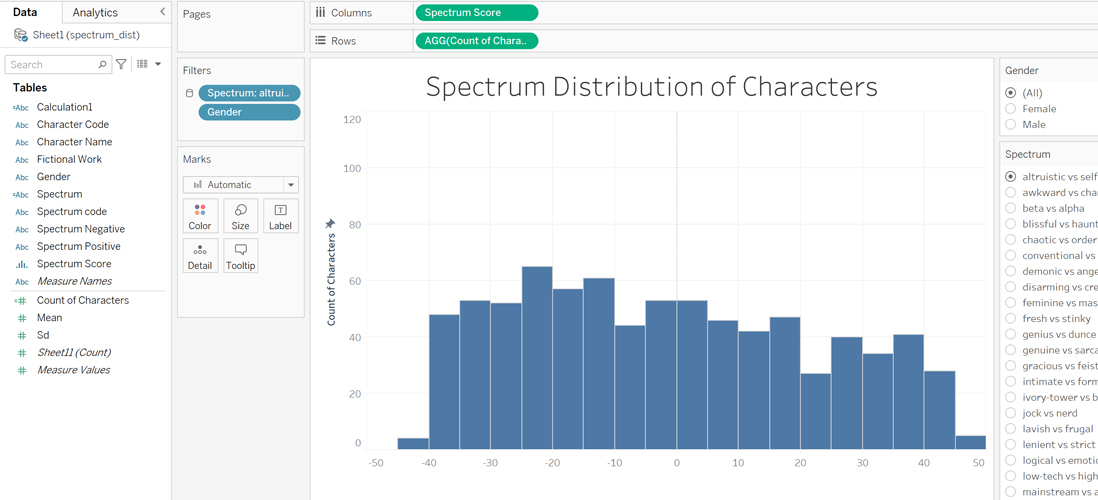
Histogram (Tableau) - Personality Spectrum Distribution of Dataset

Histogram (Tableau) - Personality Spectrum Distribution of Dataset

Saving R dataframe to Excel file First we want to first convert the full, cleaned dataset, which was written in R dataframe previously, to an Excel format.

Continue reading
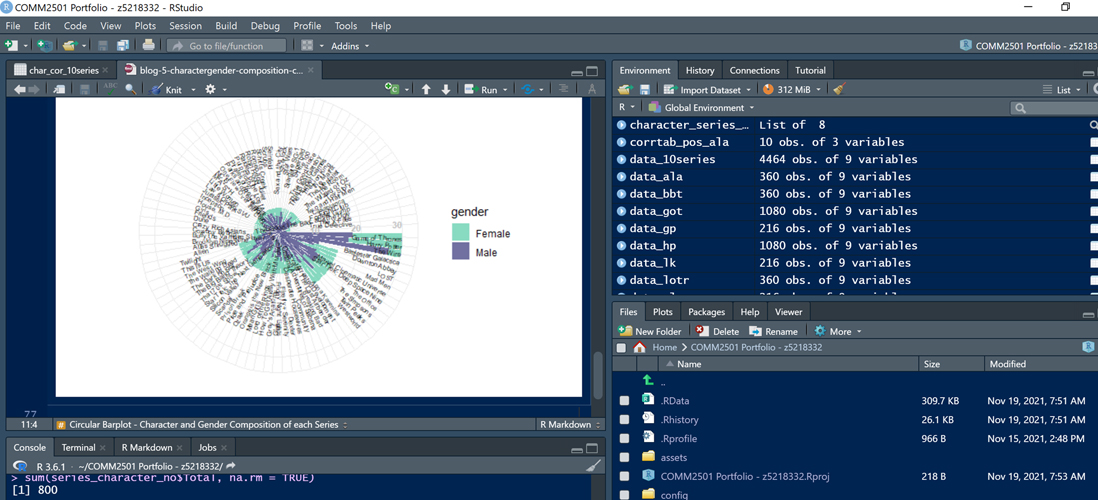
Circular Barplot - Character and Gender Composition of each Series

Circular Barplot - Character and Gender Composition of each Series

Data preparation Working with the similar data as the previous treemap, first, the dataframe file is loaded from the directory.

Continue reading