Lollipop Chart DV construction using Tableau Public
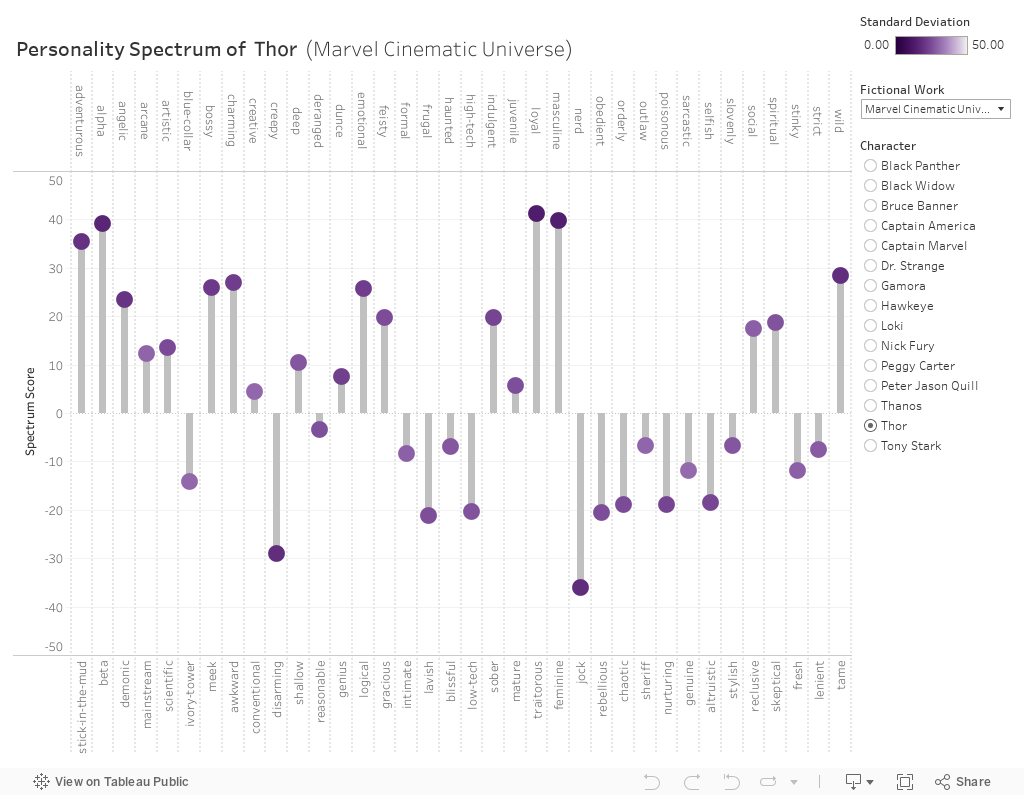
For fun, this DV aims to indicate the personality scores for the 36 spectrums in the recommended version of the Open-Psychometrics test. It will use the same excel full dataframe as the previous Tableau DV.
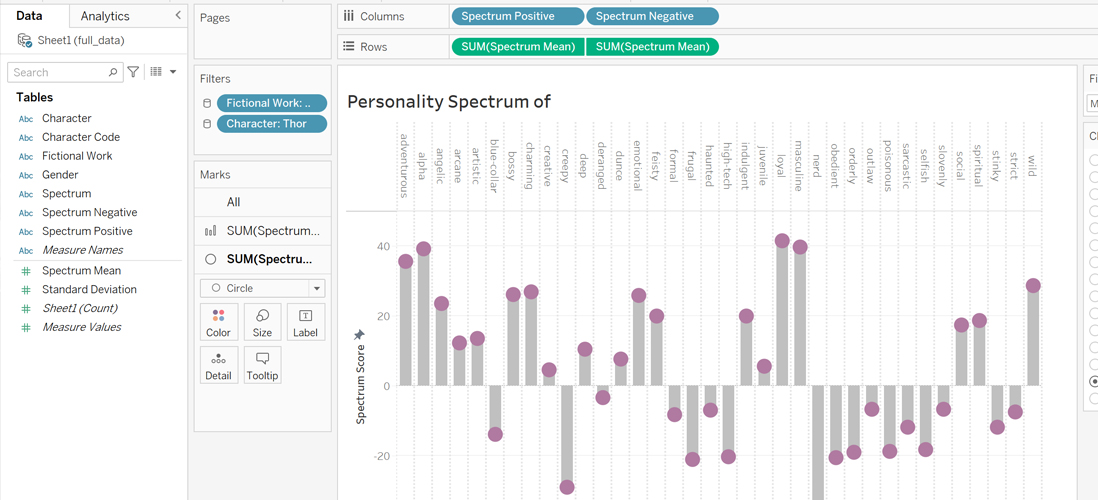
The spectrum means would be rows in the DV, while the columns would be their respective spectrums. These would be created as a barplot. As there are two sides of the spectrum, the DV will have two column labels placed on the top (for positive) and bottom (for negative) for ease of user readability.
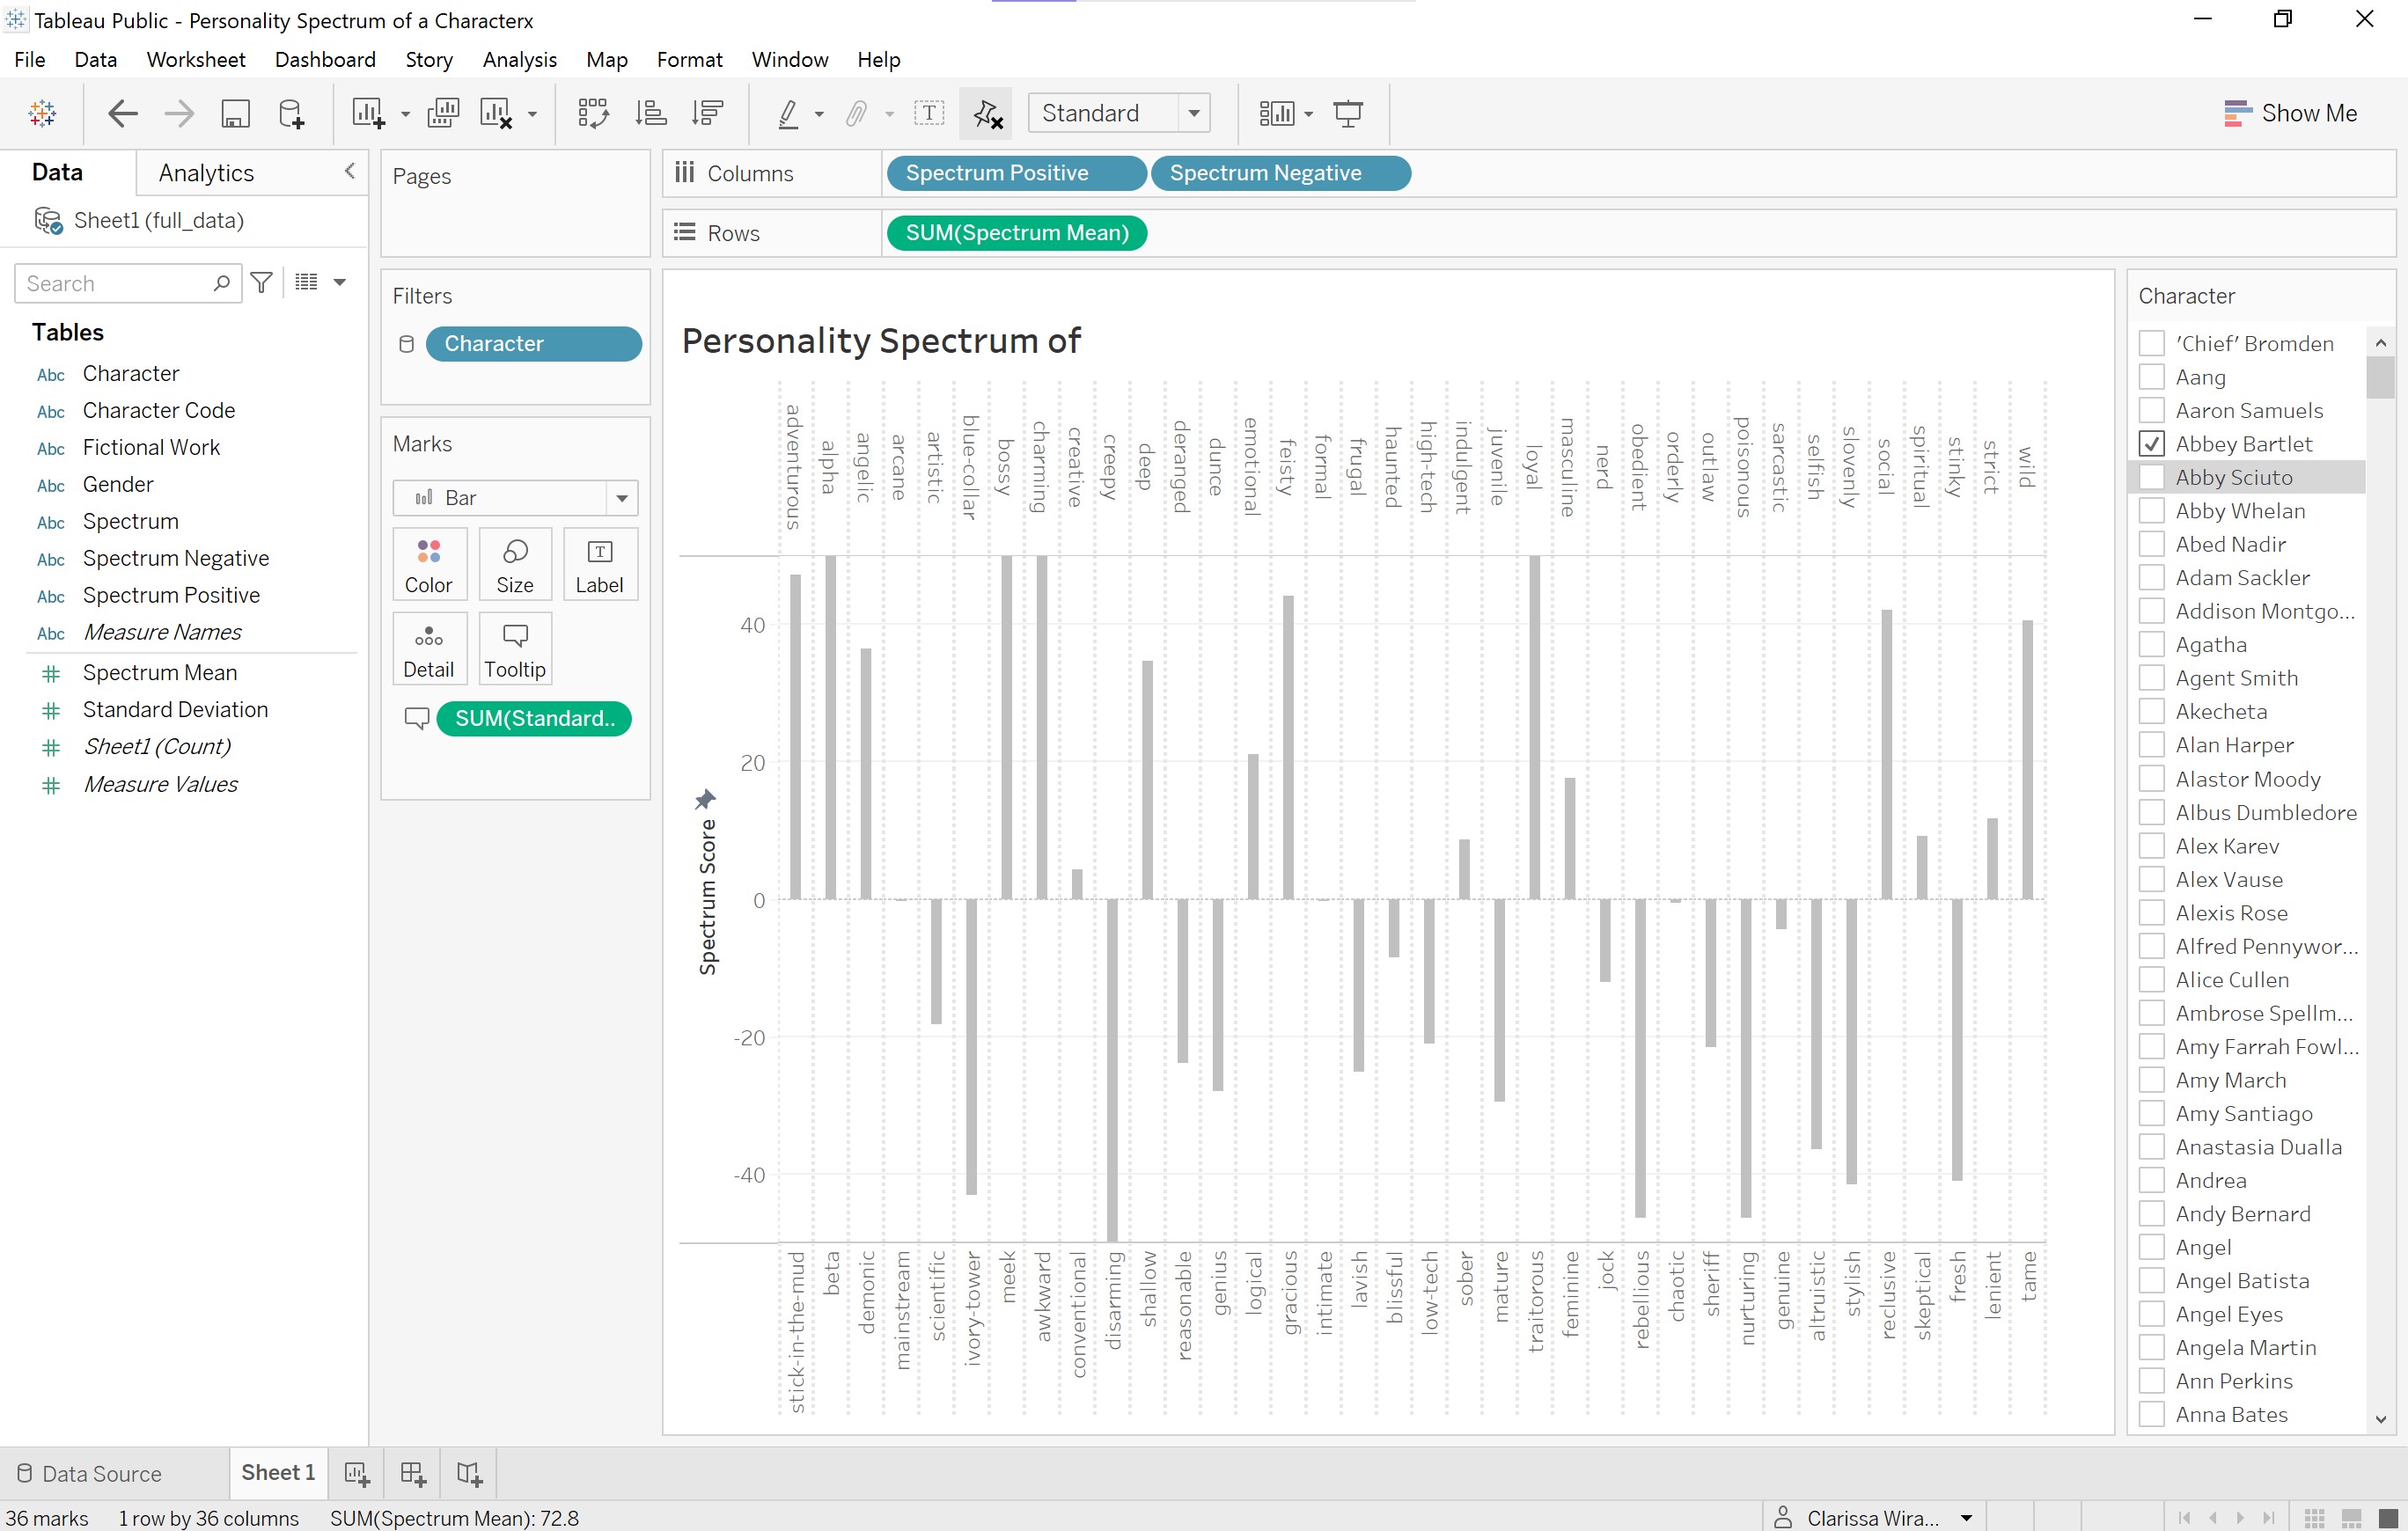
Filters using the fictional work and characters are then added for ease of user navigation, and is ensured that only one character can be selected at a time.
For the “lollipops”, an additional plot for the same spectrum means would be plotted, yet would be a scatter plot, as opposed to a barplot. After their axes have been synchronized, their sizes are adjusted to look more like lollipops! Lastly, for an added depth to the DV, the standard deviation values are used to determine the colors of the lollipops, where darker meaning less standard deviations.
A dynamic text for the title to change based on the selected character for better user readability is also created in another worksheet, and put together with the lollipop chart in the dashboard. That concludes the DV of personality spectrum indications of characters. :)