Saving R dataframe to Excel file
First we want to first convert the full, cleaned dataset, which was written in R dataframe previously, to an Excel format. For this, the writexl package is used.
load("~/COMM2501 Portfolio - z5218332/files/data_full.Rda")

library(writexl)

write_xlsx(data_full,"~/COMM2501 Portfolio - z5218332/files/data_full.xlsx")
Histogram DV construction using Tableau Public
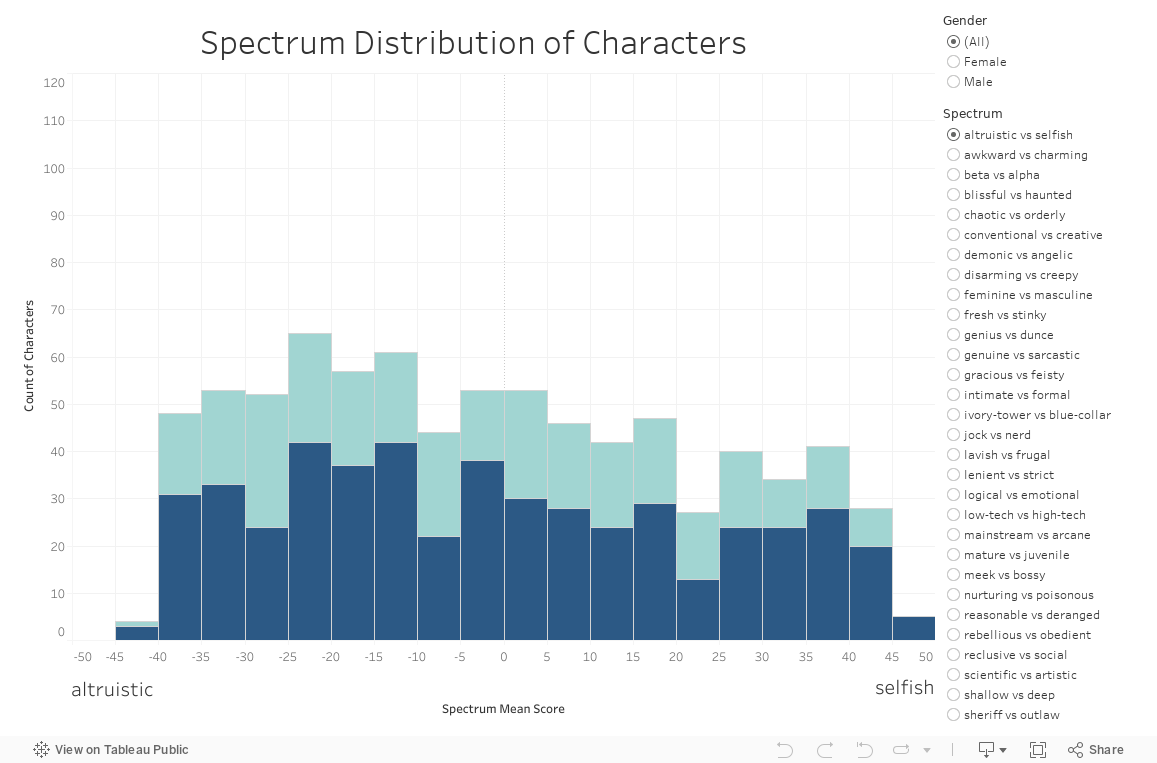
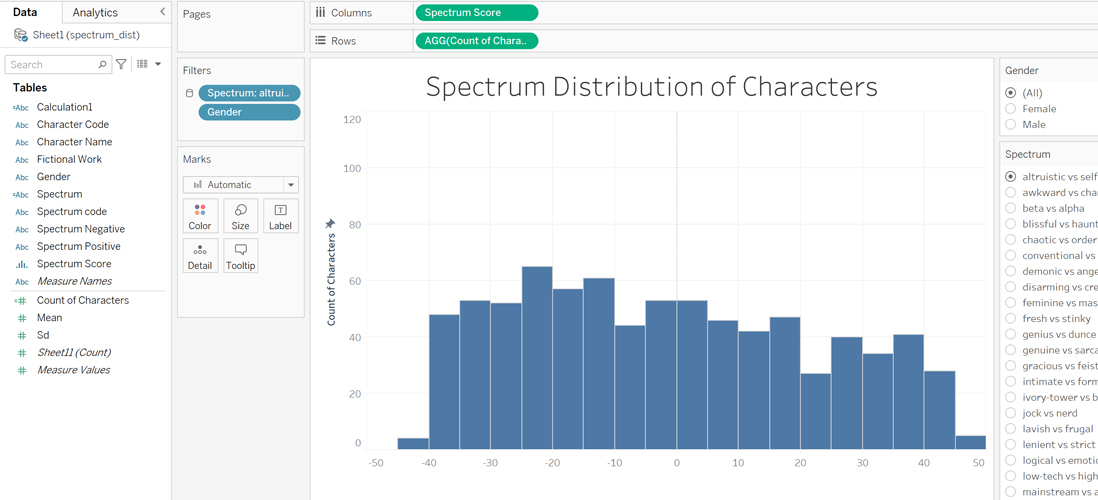
This DV would be created using Tableau Public as it offers very interactive and customizable features for data visualization.
The columns would be bins of the spectrum mean scores, and in this case, it will be grouped in bins of 5. The rows would be the amount of characters whose spectrum mean values fall inside the bin. This essentially creates a histogram.
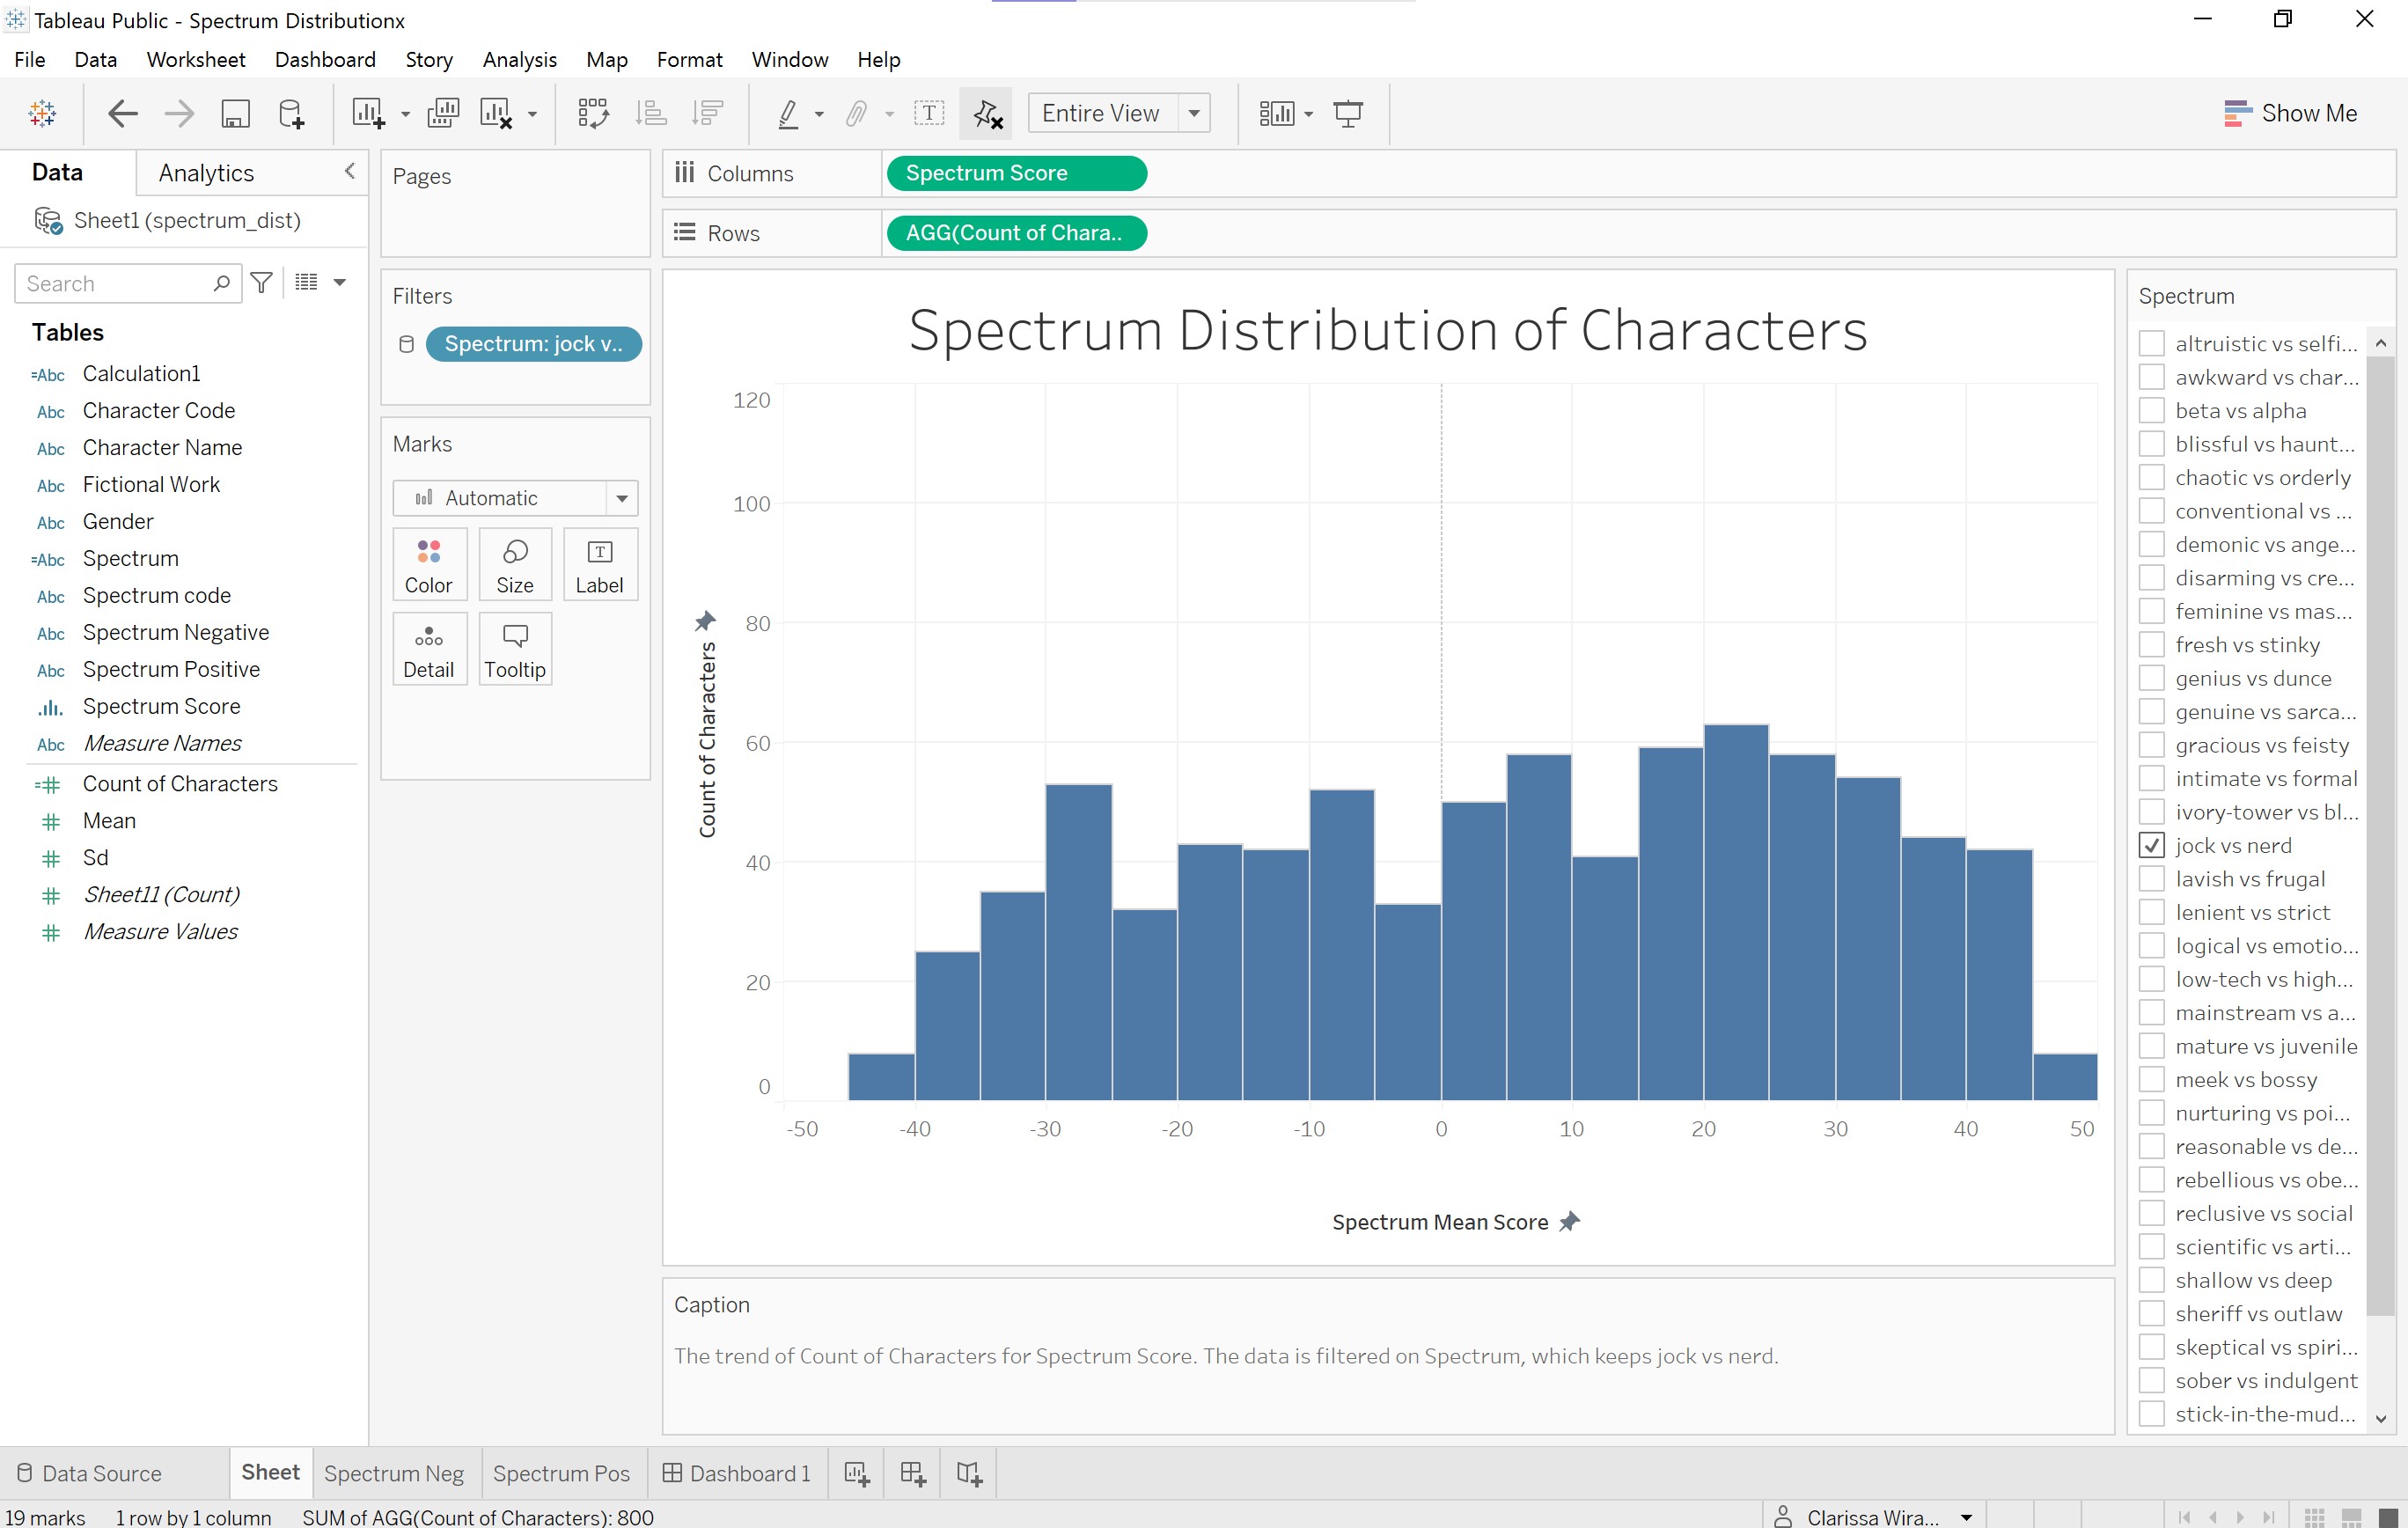
To make the histogram interactive for users to filter per spectrum, the spectrum would be inserted to the filter function. Additionally, the gender variable would also be inserted to the filter function and the color function to allow for filtering and for the histogram to display different colors for different genders.
It is then ensured that these filtering functions would only allow one selection at a time, and for the filters to apply to apply to all worksheets. Dynamic texts to indicate the negative and positive spectrums for the x axis labels are created in separate sheets. These values reflect the title of the spectrum as written by variables spectrum positive and negative in the original dataset, and will react to the filtering by the user.
Lastly, all of these worksheets are put together in a dashboard to create an interactive histogram DV.